2027 Poverty Guidelines Projection: About $16,680 for One Person
Projected 2027 federal poverty guidelines: $16,680 for one person, $34,200 for four, built from HHS's method and ten months of 2026 CPI-U.
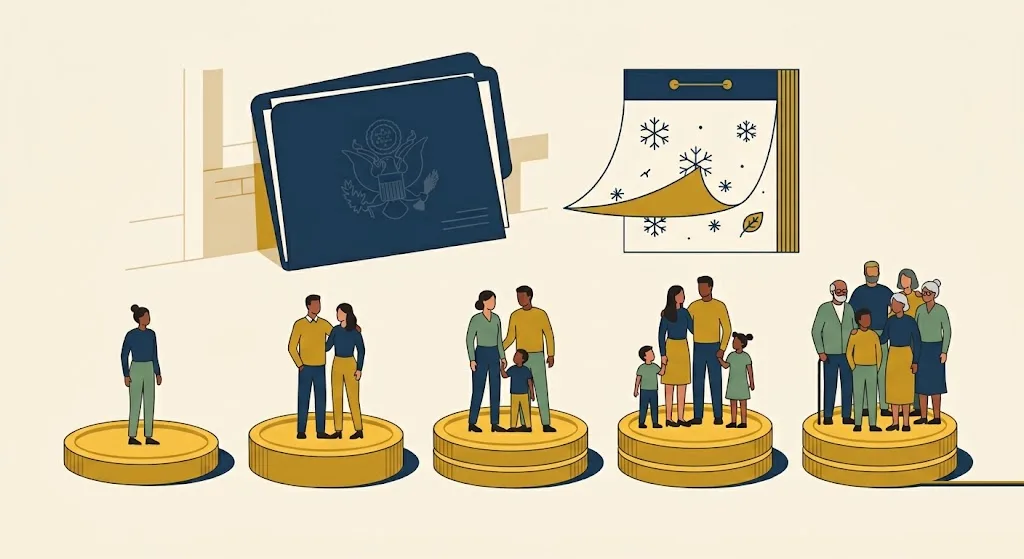
Every January a short notice appears in the Federal Register that quietly decides who qualifies for health coverage subsidies, Medicaid and a long list of other programs. The federal poverty guidelines are one of the most consequential numbers in American public policy, and they are also one of the most predictable, because the formula behind them is mechanical. The short answer: by our projection, the 2027 guideline for a single person in the 48 states and DC will be $16,680, up from $15,960 in 2026, and the guideline for a family of four will be $34,200, up from $33,000. That is $50 above the $16,630 and $34,150 we projected in our October update, because October’s CPI-U arrived on November 10 at 337.511, 0.17 percent above September. Only November and December remain open, and the real figures will not exist until the year-end inflation data arrive, so treat these as a well-grounded estimate rather than an announcement.
What the guidelines are, and what they are not
The poverty guidelines are issued by the Department of Health and Human Services, through its Office of the Assistant Secretary for Planning and Evaluation (ASPE). They are a simplified version of the Census Bureau’s poverty thresholds, the statistical yardstick used to count how many Americans are poor. The thresholds vary with family composition in a fairly intricate way, while the guidelines flatten them into a clean table by household size, which is what makes them practical for running programs. The authority comes from 42 U.S.C. 9902(2), which directs the department to update the poverty line each year using the Consumer Price Index.
Most people never see the guideline itself. They meet it as a percentage: a program might say that you qualify if your household income is below 150 percent, 200 percent or 400 percent of the poverty line. That is why a change of a few hundred dollars in the base figure matters more than it looks. The base moves, and every threshold built on top of it moves too, a point we return to below with exact multiples.
How HHS builds the table, step by step
The method is not secret, but it is scattered across ASPE’s computation tables and the explanatory language in each year’s Federal Register notice, so it is worth laying out in order. We followed the same sequence to project 2027.
The process starts with the Census Bureau’s weighted poverty thresholds for the previous year. For the 2027 guidelines that means the thresholds for 2025, which the Census Bureau publishes in September 2026. They run from $16,330 for one person and $20,730 for two, through $25,590 for three and $32,970 for four, up to $55,850 for eight people. Each of those is then multiplied by the change in the CPI-U, the Consumer Price Index for All Urban Consumers, between calendar years. The notice describes the update as the price increase between calendar years, so it compares annual averages rather than a twelve-month window ending in August, which is the main difference from the way the IRS adjusts its own figures.
Next comes a standardizing step. Census thresholds do not rise by an even amount from one household size to the next, but the guidelines do. ASPE takes the average of the differences between successive sizes and rounds it to the nearest multiple of $20, and that becomes the fixed increment per person. In 2026 it was $5,680; in 2025 it was $5,500.
The last step anchors the whole table. The four-person guideline is the inflated four-person threshold rounded up to a multiple of $50, and every other size is the four-person figure plus or minus whole multiples of the increment. We should be candid about that last rule: ASPE does not write the $50 rule down anywhere, so it is our deduction from the published tables. It fits the four-person figure in each of 2023, 2024, 2025 and 2026, which is the kind of evidence one can reasonably lean on, but it remains an inference. Finally, if rounding would push any figure below its prior-year value while inflation is not negative, the figure is held at the prior-year level, as the 2026 notice describes.
Applying that to our central scenario, the inflated four-person threshold comes to $34,153.30, just over a multiple of $50, so the anchor rounds up to $34,200. Subtracting three increments of $5,840 gives $34,200 minus $17,520, which is $16,680 for one person. The remaining sizes follow by adding one increment at a time.
The test: does the method reproduce the past?
A projection is only as good as the method behind it, so before looking forward we ran the same procedure on years whose answers are already published. For each of 2023, 2024, 2025 and 2026 it reproduces both the official one-person figure and the official per-person increment, which makes four years out of four on both checks. The 2025 table, for instance, had $15,650 for one person, $5,500 per additional person and $32,150 for four people, and the method returns exactly those numbers.
The October 2025 hole in the inflation data
The government shutdown in the fall of 2025 meant the Bureau of Labor Statistics never collected October 2025 prices, so the CPI-U series has a month that simply does not exist. That matters for anything built on a calendar-year average, because an average needs twelve numbers and 2025 has eleven.
HHS had to decide what to do when it calculated the 2026 guidelines, and it chose to average the 11 months that are available. By that count the 2025 CPI-U averaged 321.943, against 313.689 for 2024, a rise of 2.63 percent, which is the figure printed in the Federal Register notice. The Treasury had faced the same gap first, for inflation-protected securities, and in November 2025 it filled October with an estimate instead; HHS was, as far as we can tell, the first agency to leave the month out. The IRS has since published its 2027 tax figures, and they point to the same 11-month approach, although the IRS has not said so (more on that at the end of this page). For this projection the choice is settled, because the 2027 guidelines will compare 2026 against 2025, and HHS has already shown which 2025 base it uses. We use the same 321.943.
The ten months we know and the two we do not
The 2026 side of the comparison is nearly complete, with ten of its twelve months in. These are the monthly CPI-U readings (not seasonally adjusted) from the Bureau of Labor Statistics so far:
| Month 2026 | CPI-U |
|---|---|
| January | 325.252 |
| February | 326.785 |
| March | 330.213 |
| April | 333.020 |
| May | 335.123 |
| June | 333.952 |
| July | 333.918 |
| August | 334.980 |
| September | 336.940 |
| October | 337.511 |
November and December are missing. October, published on November 10, 2026, rose 0.17 percent over September, a much gentler step than the 0.59 percent of September itself, but enough to lift the table by $50 at both ends. The December index will not appear until mid-January 2027, which is also when HHS normally publishes. To bracket the uncertainty we ran four scenarios for the last two months, now starting from the real October.
| Scenario for Nov-Dec 2026 | 2026 average | Inflator vs. 321.943 | 1 person | Per added person | 4 people |
|---|---|---|---|---|---|
| Flat (same as October) | 333.560 | 1.03608 | $16,680 | $5,840 | $34,200 |
| 2025 seasonal pattern (central) | 333.498 | 1.03589 | $16,680 | $5,840 | $34,200 |
| High (+0.3% a month) | 333.813 | 1.03687 | $16,620 | $5,860 | $34,200 |
| Low (-0.2% a month) | 333.391 | 1.03556 | $16,630 | $5,840 | $34,150 |
We treat the second row as the central case because it copies the shape of last year, when prices eased slightly through December after September: here, taking last year’s missing October as the midpoint of September and November, that means November about 0.10 percent below October and December about 0.02 percent below November. The flat and central scenarios give the same table: $16,680, $5,840 and $34,200. The low scenario gives $16,630 and $34,150, and the high one $16,620, $5,860 and $34,200. The odd-looking ordering in the high scenario, where the one-person figure ($16,620) is lower than the central $16,680 despite higher inflation, is a product of the rounding rules rather than a mistake; the increment and the anchor are rounded separately, so the one-person figure, which is the anchor minus three increments, can move in the opposite direction to the headline inflator.
What matters is where the November-December average lands. With the ten known months fixed, three ranges cover every realistic outcome:
- An average of the two months at or below 336.945, about 0.17 percent below October, brings back the old table: $16,630, $5,840 and $34,150 (the one-person figure holds there down to an average of about 334.0).
- Between 336.945 and 337.707, up to 0.06 percent above October, the result is $16,680, $5,840 and $34,200. Our central case, with a November-December average of about 337.14, sits in this band.
- Between 337.707 and 339.875, up to 0.70 percent above October, it becomes $16,620, $5,860 and $34,200. Only an average higher still, well beyond our high scenario, would move the table again, to $16,670, $5,860 and $34,250.
One caution about the central case. Its four-person threshold comes out at $34,153.30, only about $3 above the $34,150 line at which the anchor would round down, and the flat scenario reaches $34,159.70. A slightly softer November or December than last year’s pattern would therefore bring back the $34,150 and $16,630 table, which is why the low scenario is not far-fetched.
The full 2027 table against 2026
Here is the central projection beside the official 2026 guidelines for the 48 states and DC.
| Household size | 2026 official | 2027 projected | Difference |
|---|---|---|---|
| 1 | $15,960 | $16,680 | $720 |
| 2 | $21,640 | $22,520 | $880 |
| 3 | $27,320 | $28,360 | $1,040 |
| 4 | $33,000 | $34,200 | $1,200 |
| 5 | $38,680 | $40,040 | $1,360 |
| 6 | $44,360 | $45,880 | $1,520 |
| 7 | $50,040 | $51,720 | $1,680 |
| 8 | $55,720 | $57,560 | $1,840 |
The difference grows with household size because the per-person increment itself rises, from $5,680 to $5,840, a gap of $160 that accumulates with each additional member. Alaska and Hawaii each have separate and higher tables. This page does not project them; for orientation, the official 2026 one-person guideline is $19,950 in Alaska and $18,360 in Hawaii.
What a percentage of the poverty line looks like in dollars
Because programs set their cutoffs as multiples of the guideline, the useful way to read the table is to multiply it out. These are the exact multiples of the central 2027 projection for households of one to four people.
| Household size | 150% | 200% | 400% |
|---|---|---|---|
| 1 | $25,020 | $33,360 | $66,720 |
| 2 | $33,780 | $45,040 | $90,080 |
| 3 | $42,540 | $56,720 | $113,440 |
| 4 | $51,300 | $68,400 | $136,800 |
Take a family of four at 400 percent. In 2026 that line sits at $132,000, four times $33,000. On the projected 2027 table it would be $136,800, which is $4,800 higher. Keep in mind that each program applies its own rounding and its own effective date, so the multiples above are the arithmetic starting point, not a guarantee of any program’s final cutoff.
Which year’s guidelines does each program use?
This is the part that most often goes wrong. The 2027 guidelines are not in force for 2027 for everything. Under the ACA, premium tax credits for a coverage year are computed from the guidelines published before the open enrollment period for that year begins. Coverage in 2027 is therefore measured against the 2026 guidelines, and the 2027 guidelines will be the ones that apply to coverage in 2028. If you are trying to understand next year’s subsidy cliff, our table of ACA premium tax credits at 400 percent of the poverty line uses the right year, and the way the percentage is read on the tax return is explained in the guide to Form 8962 line 5.
Medicaid and CHIP operate on a different clock. They typically adopt each new set of guidelines during the year in which it is published, and the date is chosen by the program or by the state.
Student borrowers meet the guideline in a third way. The older income-driven repayment plans measure discretionary income as the amount above a multiple of the poverty line, so a higher guideline leaves more of your income protected from the payment formula; our deep dive on income-driven repayment plans shows how each plan does it. The new Repayment Assistance Plan works differently, basing the payment on adjusted gross income without a poverty-line allowance, so the guideline matters less there.
What could still change
Several things could still move the final numbers, and it is more honest to list them than to hide behind a single figure.
The first and largest is the remaining 2026 inflation data. October is now in and only November and December are open, but the table is not final until the December release in mid-January 2027. Our scenarios put the one-person guideline between $16,620 and $16,680 and the four-person figure between $34,150 and $34,200, and the thresholds above show how little it takes to cross from one table to the next.
The second is the formula itself: the $50 anchoring rule is our deduction, not a published rule, so a change in HHS’s rounding could make the projection miss by more than the inflation scenarios suggest.
The third is the missing October 2025 month. HHS has already settled how the 2025 base is treated, which is why this page uses 321.943, but a similar gap in future data would force the same choice again.
The fourth concerns other agencies, and here the question has been answered. The IRS adjusts its own tax figures using a different inflation measure and a different twelve-month window, and it published its 2027 figures in Revenue Procedure 2026-35 on November 5, 2026. The revenue procedure does not say how it treated the missing October 2025 index, but the figures it contains point to an average of 11 months, as HHS used; that is our deduction, not a statement from the IRS. The details are in our 2027 IRS inflation adjustments tracker.
Sources
- HHS, Annual Update of the HHS Poverty Guidelines, 91 FR 1797 (Jan. 15, 2026) — govinfo.gov
- ASPE, 2026 poverty guidelines computations — aspe.hhs.gov
- ASPE, poverty guidelines — aspe.hhs.gov
- Census Bureau, poverty thresholds for 2025 — census.gov
- 42 U.S.C. 9902(2) — law.cornell.edu
- Bureau of Labor Statistics, CPI-U (series CUUR0000SA0) — api.bls.gov
Quick answers
What will the 2027 federal poverty guideline be for one person?
Our central projection is $16,680 for one person in the 48 contiguous states and DC, and $34,200 for a family of four, with $5,840 added for each additional person. That compares with $15,960 and $33,000 in 2026. Before October's CPI-U we projected $16,630 and $34,150; the October print of 337.511, 0.17 percent above September, left the 2026 average higher and moved the table up. The figure is still a projection, not an official number: HHS normally publishes the real guidelines in mid-January, and the 2026 update appeared on January 15, 2026.
When does HHS publish the new poverty guidelines?
Normally in the middle of January. The 2026 guidelines were published in the Federal Register on January 15, 2026 (91 FR 1797) and took effect on January 13, 2026. The 2027 guidelines depend on the calendar-year average of the CPI-U, which cannot be finished until the December index is released in mid-January 2027, so no official 2027 figure can exist before then.
Do the 2027 poverty guidelines apply to my 2027 ACA premium tax credit?
No. The ACA premium tax credit for a coverage year uses the guidelines published before the start of the open enrollment period for that year, so 2027 coverage is measured against the 2026 guidelines. The 2027 guidelines will matter for 2028 coverage. Medicaid and CHIP work differently: they usually adopt each new set of guidelines at some point during the year in which it is published, on a date set by the program or the state.
Does the missing October 2025 CPI-U affect the poverty guidelines?
It already did, once. HHS calculated the 2026 guidelines using the average of the 11 months of 2025 that the Bureau of Labor Statistics did collect, which put the 2025 CPI-U average at 321.943 against 313.689 for 2024, an increase of 2.63 percent. The Treasury had gone the other way in November 2025, imputing an October figure for its inflation-protected securities, so, as far as we can tell, HHS was the first agency to leave the month out. Our 2027 projection uses that same 321.943 as its 2025 base.
Why does the projection not include Alaska and Hawaii?
Alaska and Hawaii have their own, higher guideline tables, and this page projects only the figures for the 48 contiguous states and the District of Columbia. For reference, the official 2026 one-person figures are $19,950 in Alaska and $18,360 in Hawaii, but we do not project 2027 values for either state.
Educational content only. finbarrow is an independent editorial publication, not a licensed financial advisor, broker, tax preparer, or attorney. Verify rates and terms with the issuer or relevant regulator. See disclaimers and funding disclosures.